Incident Management Insight Analytics and Reporting Solutions for ServiceNow
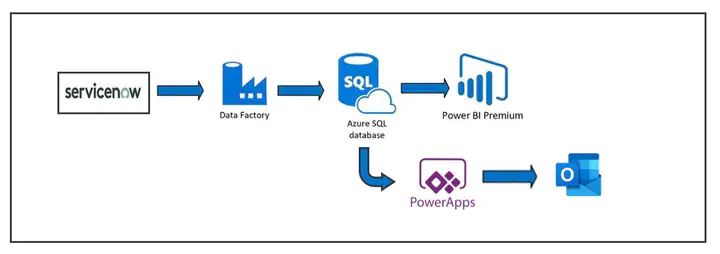
In the Incident Management Insight Analytics and Reporting Solutions for ServiceNow project, a robust pipeline has been developed to collect and store data on ServiceNow tickets. The pipeline enables API calls to ServiceNow four times a day, and the resulting information is saved in a SQL database. This approach provides greater flexibility in creating measures and calculations that can provide deeper insights into ServiceNow tickets.

To visualize the insights derived from the pipeline, a Power BI dashboard has been created. The dashboard highlights critical information such as open tickets, unassigned tickets, the average time it takes for a ticket to be assigned, and the average time it takes to resolve a ticket. It also provides information about each employee’s workload, including the number of open and resolved tickets.
Moreover, the Power BI dashboard also provides insights on a higher level, such as the performance of each queue in ServiceNow. The system can even predict the number and type of tickets that may occur in the future using Python coding within Power BI. The insights derived from this analysis will help managers understand their team’s performance and make data-driven decisions to improve ServiceNow operations.
Furthermore, the system also provides information about each ticket’s category and the number of tickets with a second assignee, making it easier to prioritize and allocate resources to resolve issues promptly. Overall, the Incident Management Insight Analytics and Reporting Solutions for ServiceNow project provides a comprehensive solution for monitoring and analyzing ServiceNow tickets to improve operational efficiency and enhance customer satisfaction.