Power BI Usage Report and Adoption Rate
The Power BI Usage Report and Adoption Rate project is a powerful reporting tool that tracks all user logs to Power BI across an organization’s workspaces. This report provides valuable insights into the organization’s investment in Power BI development and whether users are actively engaging with the reports.
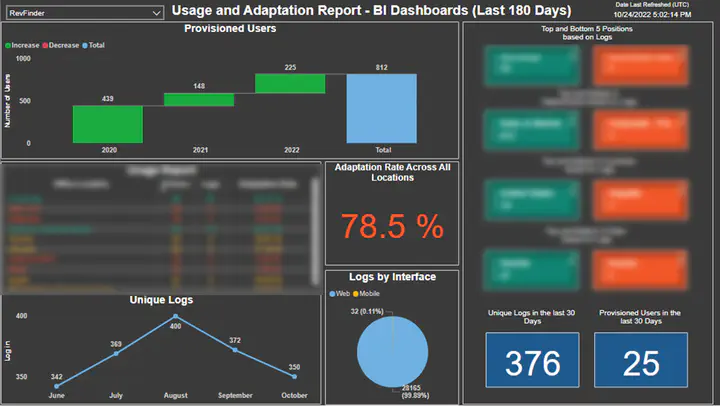
The project tracks daily, monthly, and other metrics to understand the frequency with which each dashboard is used, who is using it, and which hotel properties are utilizing it the most. Additionally, the report provides an adoption rate metric, which measures the percentage of users who have been provisioned and added to the groups but are actively using the reports.
The project also analyzes the type of devices used to access the reports, including laptops and mobile phones, providing a comprehensive understanding of the user experience. The report provides valuable insights into the usage patterns of users, enabling administrators to optimize and improve the user experience.
Finally, the Power BI Usage Report and Adoption Rate project tracks the number of users being provisioned since the launch every month, providing valuable insights into the growth and expansion of the organization’s use of Power BI.
Overall, this project is an essential tool for organizations looking to optimize their Power BI usage and adoption rates. By tracking usage patterns, adoption rates, and user metrics, the project enables organizations to make informed decisions to improve the user experience, increase adoption rates, and ultimately maximize their investment in Power BI.